
Rainfall chart reveals intensity of August flooding
Steve Bandy
Rayne Acadian-Tribune
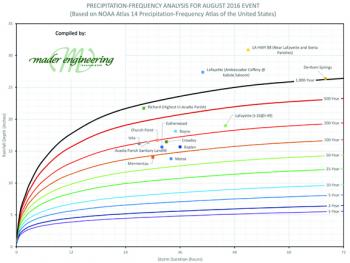
When personnel at Mader Engineering began compiling data regarding the Aug. 12 - 13 flooding event in Acadiana, some interesting facts came to light.
“The chart shows the various intensities of the rainfall experienced at various places all around Acadia Parish in terms of what meteorologists refer to as ‘50-year storms’ or ‘100-year storms’ or ‘200-year storms’ or even ‘1,000-year storms,’ etc.” Mader explained.
Not that Rayne experienced an intensity and duration somewhere between the 200-year and 500-year storm.
“Also note that, contrary to popular belief, the intensity of such storms can vary significantly from place to place — even places that area only a few miles apart,” Mader pointed out. “Richard, for example, had the highest intensity in the parish, nearly a 1,000-year storm, but nearby Church Point was at the 200-year storm level.”
But exactly what is a “100-year storm?” Does it indicate a storm that happens only once in a century.
Actually, no — it’s a little more complicated than that.
Meteorologists, climatologists and hydrologists calculate 100-year events as a statistical tool to determine the likelihood of intense storms or floods.
For example, meteorologists use the average year-to-year rainfall in a given area to figure out the chances of having a storm of potentially epic proportions.
What it means is that every year there’s a 1-in-100 chance of one of these storms happening.
So, while these events have a lower statistical likelihood of happening than an average thunderstorm, they can and do happen, sometimes within just a few years of each other.
While there’s not much that can be done about the intensity or duration of a storm, steps are being taken on a parishwide scale to understand why some areas that had never flooded before reported high water levels during the mid-August event.
James “Jimbo” Petitjean, parish assessor, is funding a program that he hopes will help parish residents prepare for another such occurrence in the event it happens earlier than the meteorological terminology would have you believe.
Mader Engineering, Fenstermaker & Associates (a Lafayette-based mapping company) and the UL Lafayette Civil Engineering Department are producing a hydrological map of the parish that will show where and how water flows in the event of another flooding event.
That type of information is relevant is explaining why Crowley, which got less rain over a shorter period of time than Rayne did, experienced extended flooding conditions while Rayne did not.
“We’re all working with each other to exchange data and compile it all for future reference in fighting storms like this one,” Mader said.
- Log in to post comments